Kerry Rodden
Data Visualization Developer, Creative Technologist, Teacher
Professional Work
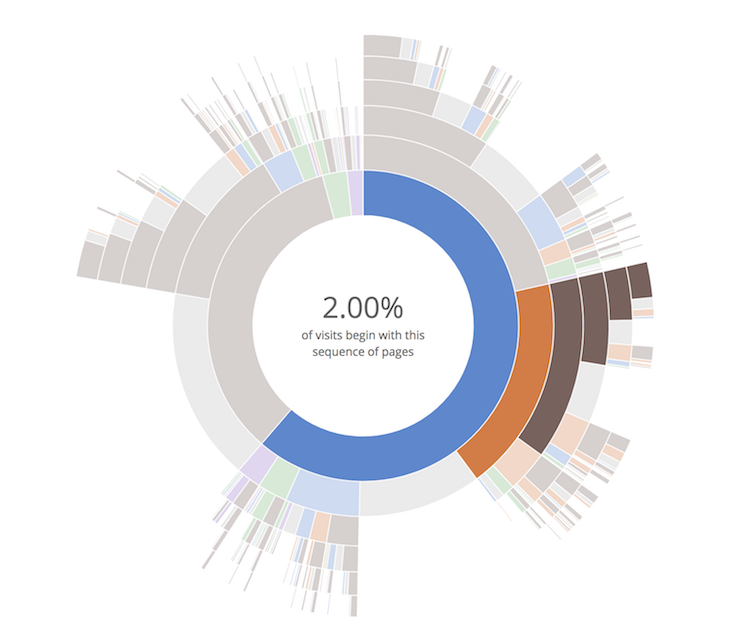
Sequences Sunburst
Interactive visualization for analyzing aggregated user paths. Developed at YouTube and widely adopted by other organizations.
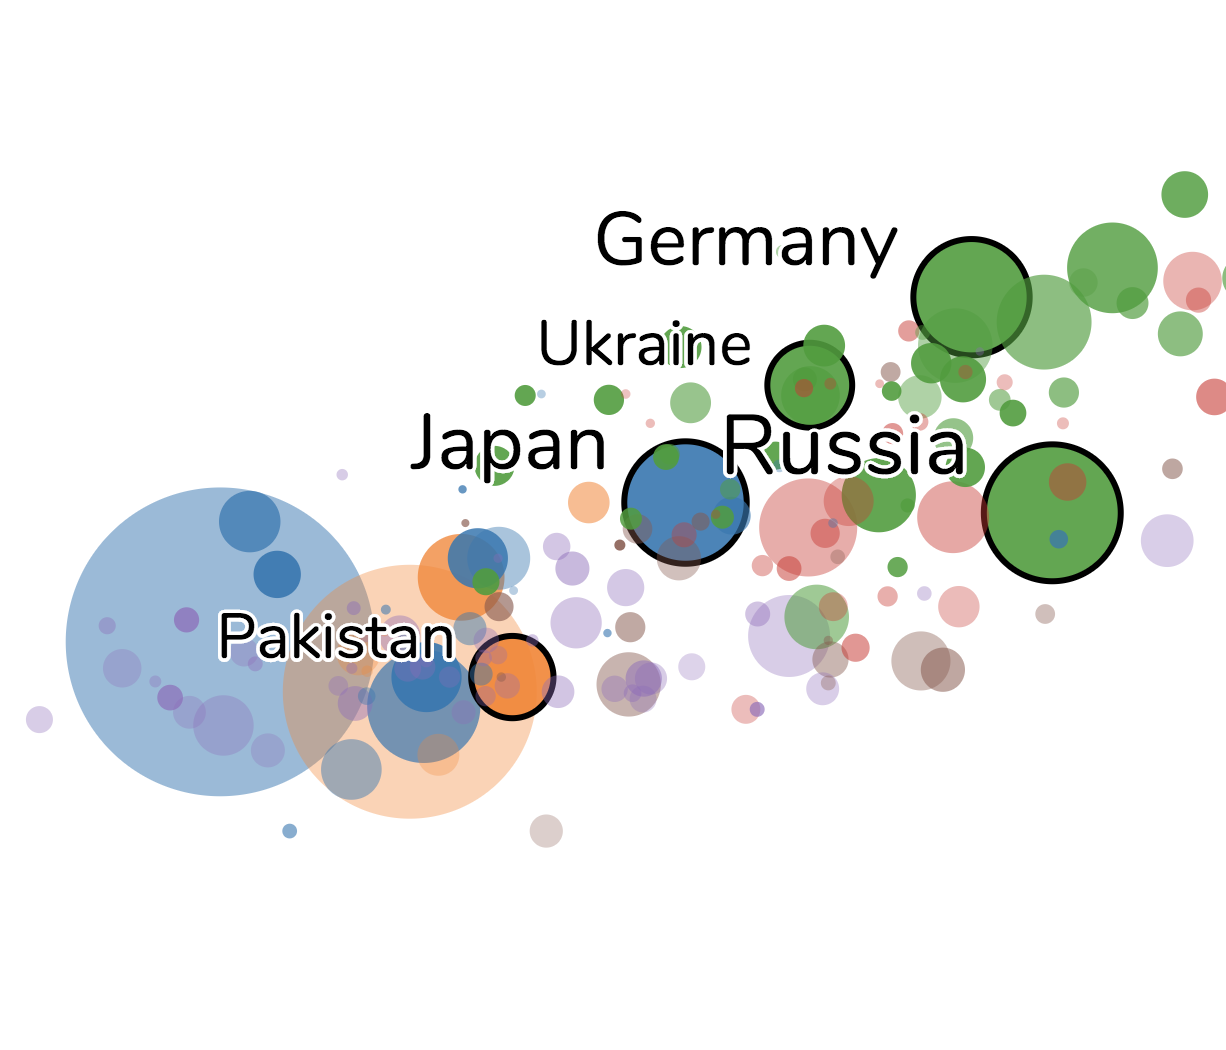
Dynamic Labels
Automatic labeling of circles in a motion chart according to their movement. Developed at Google and used to create a YouTube Rewind marketing video.
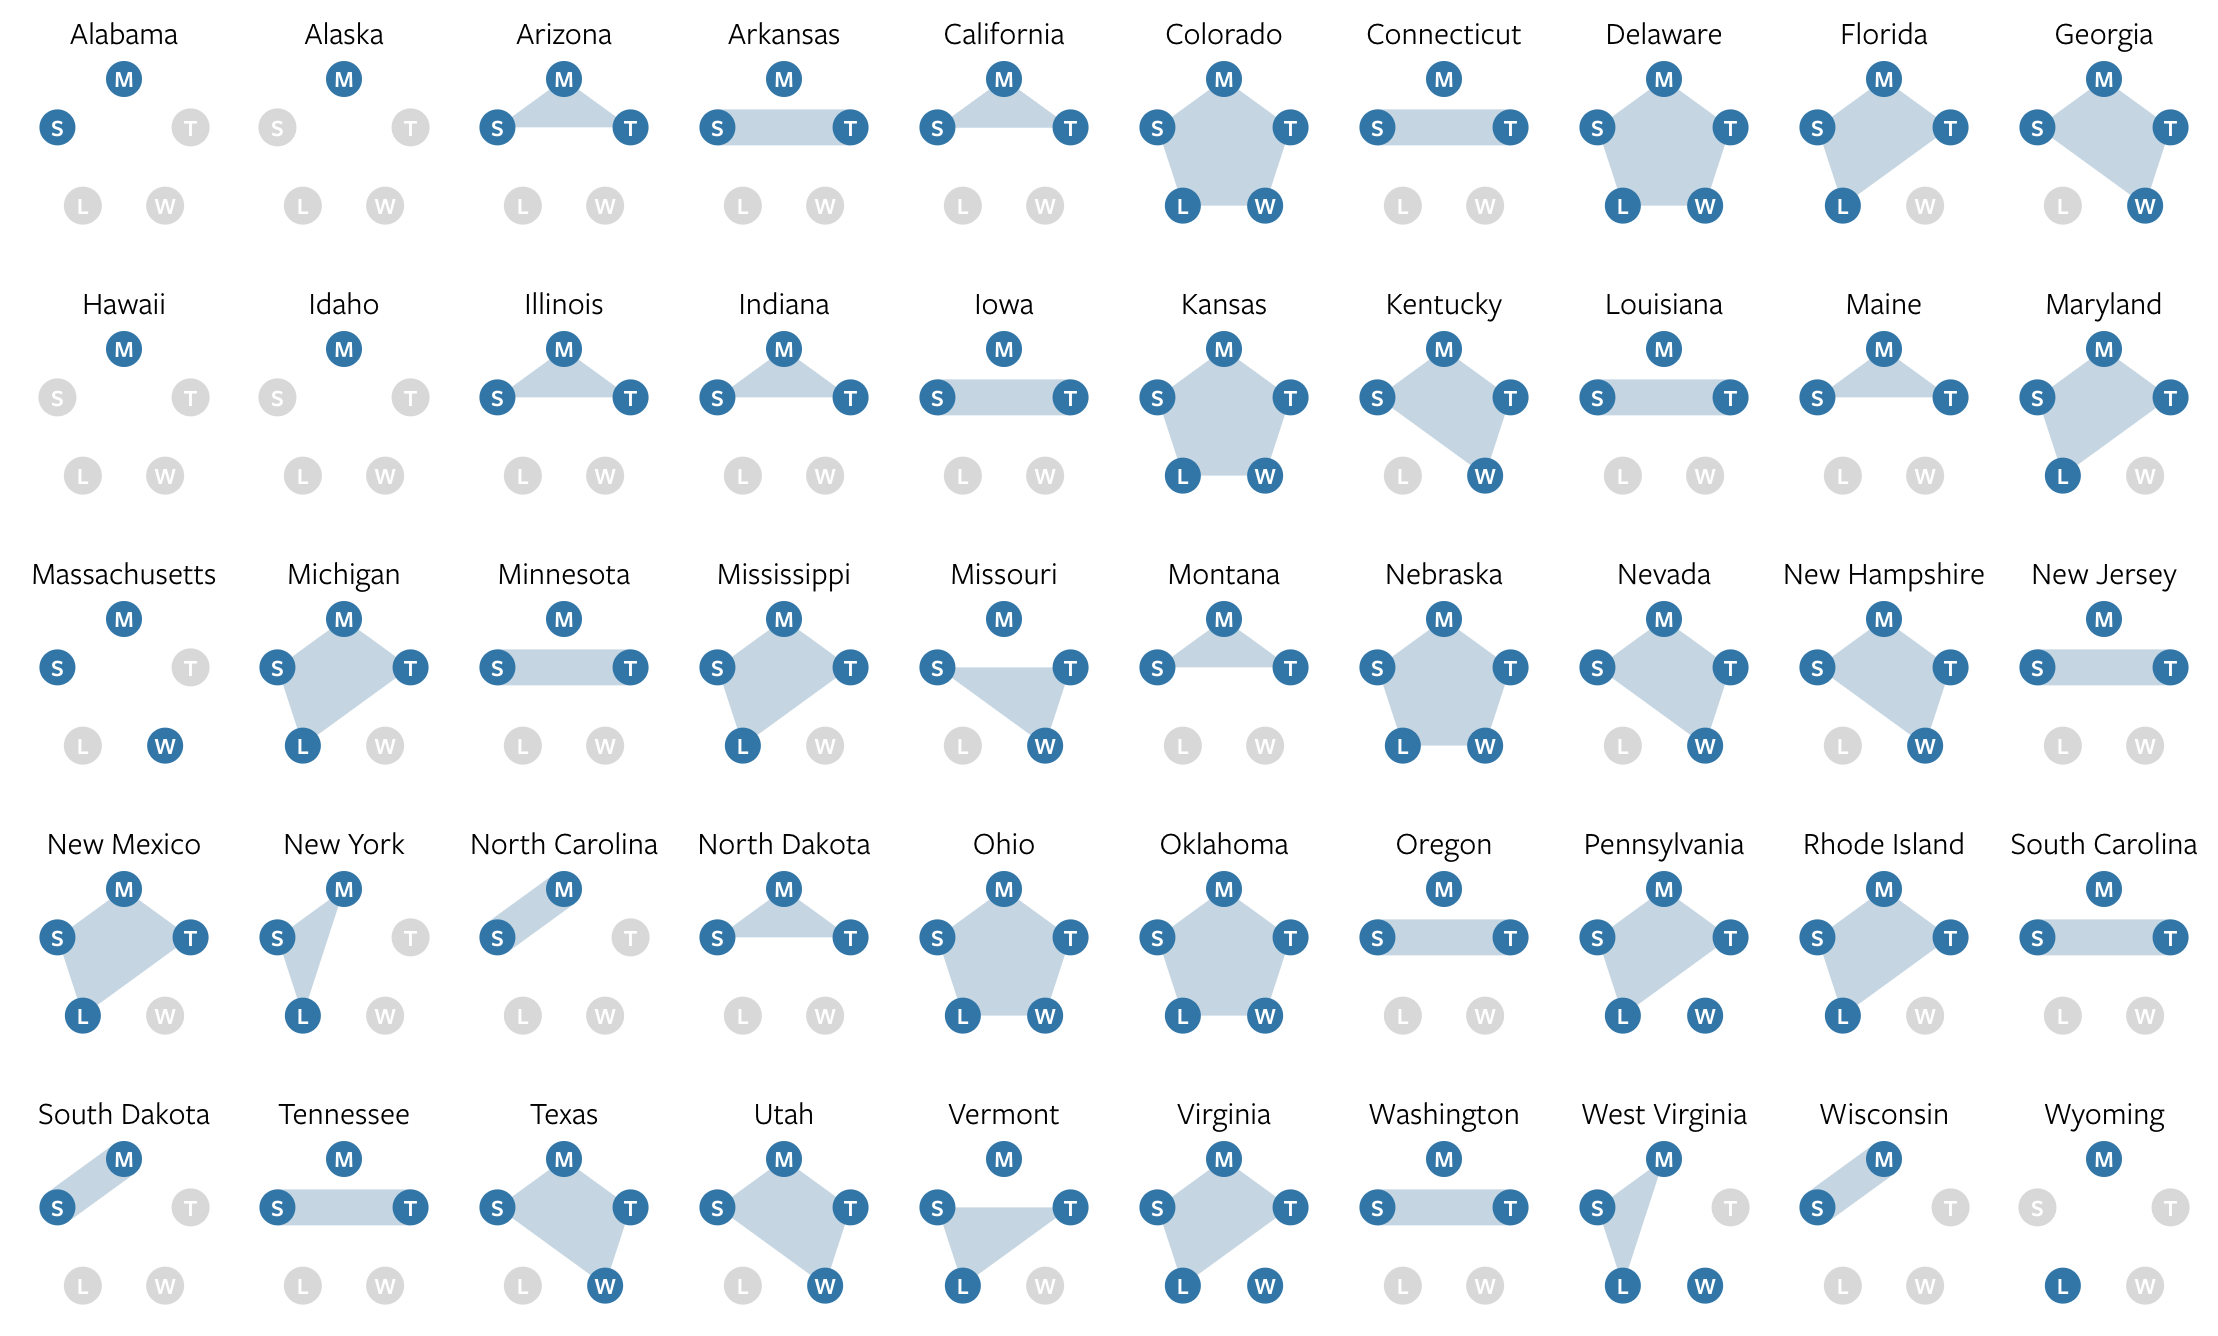
Benefits Scorecard
Novel visualization that represents both the availability and integration of online benefits applications across states. Designed for Code for America.
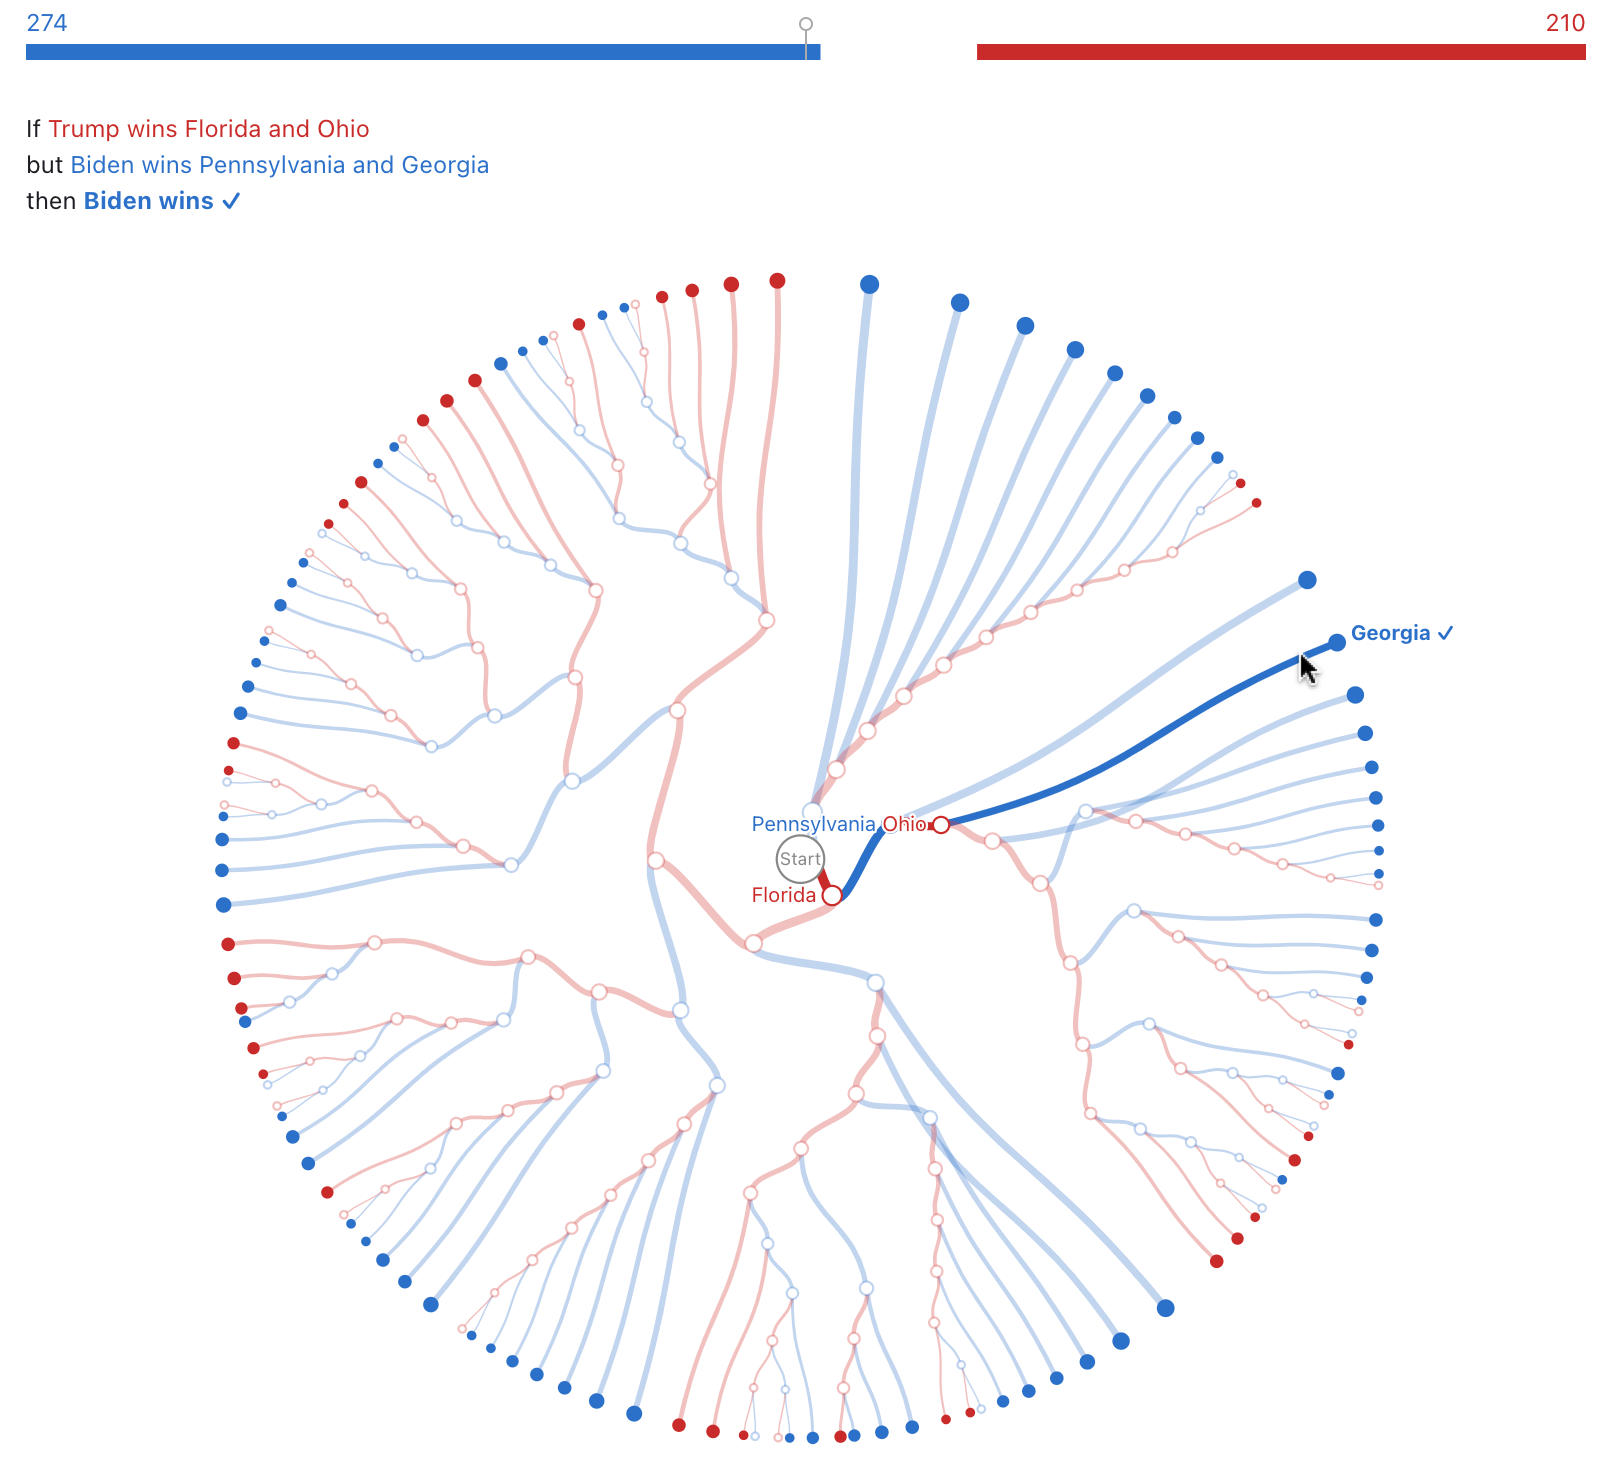
Electoral College Decision Tree
Interactive exploration of possible presidential election outcomes. Created at Observable.
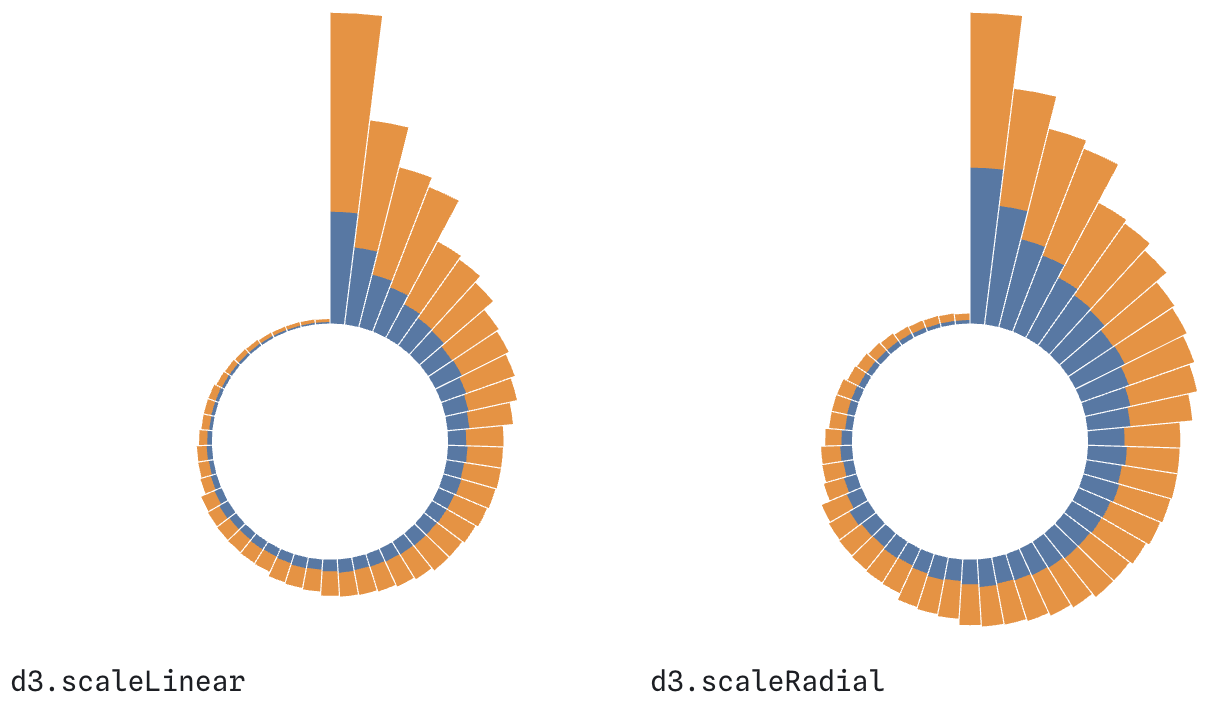
Radial Visualization Explainer
Interactive article explaining radial visualization techniques and when to use them. Created at Observable.
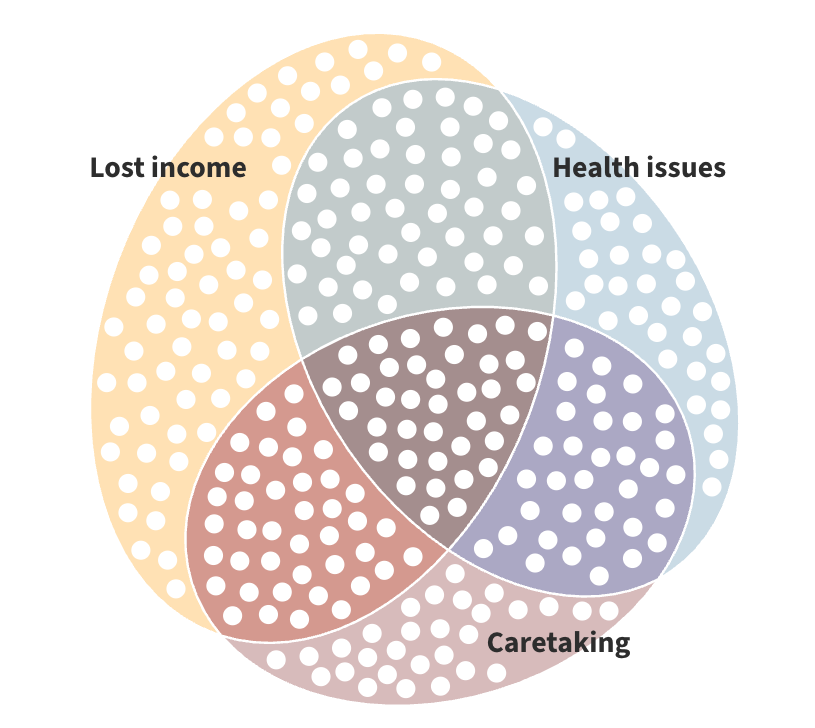
Compounded Hardships
Interactive visualization exploring multiple challenges. Created at Code for America.
The above examples are from professional work that can be shown publicly. I have also completed a range of other projects that are internal to organizations, such as:
- Internal visualization for executives of the status of key customers
- Design and prototyping of customer-facing visualizations in B2B products
- Analysis and visualization of in-product survey results
Personal Projects
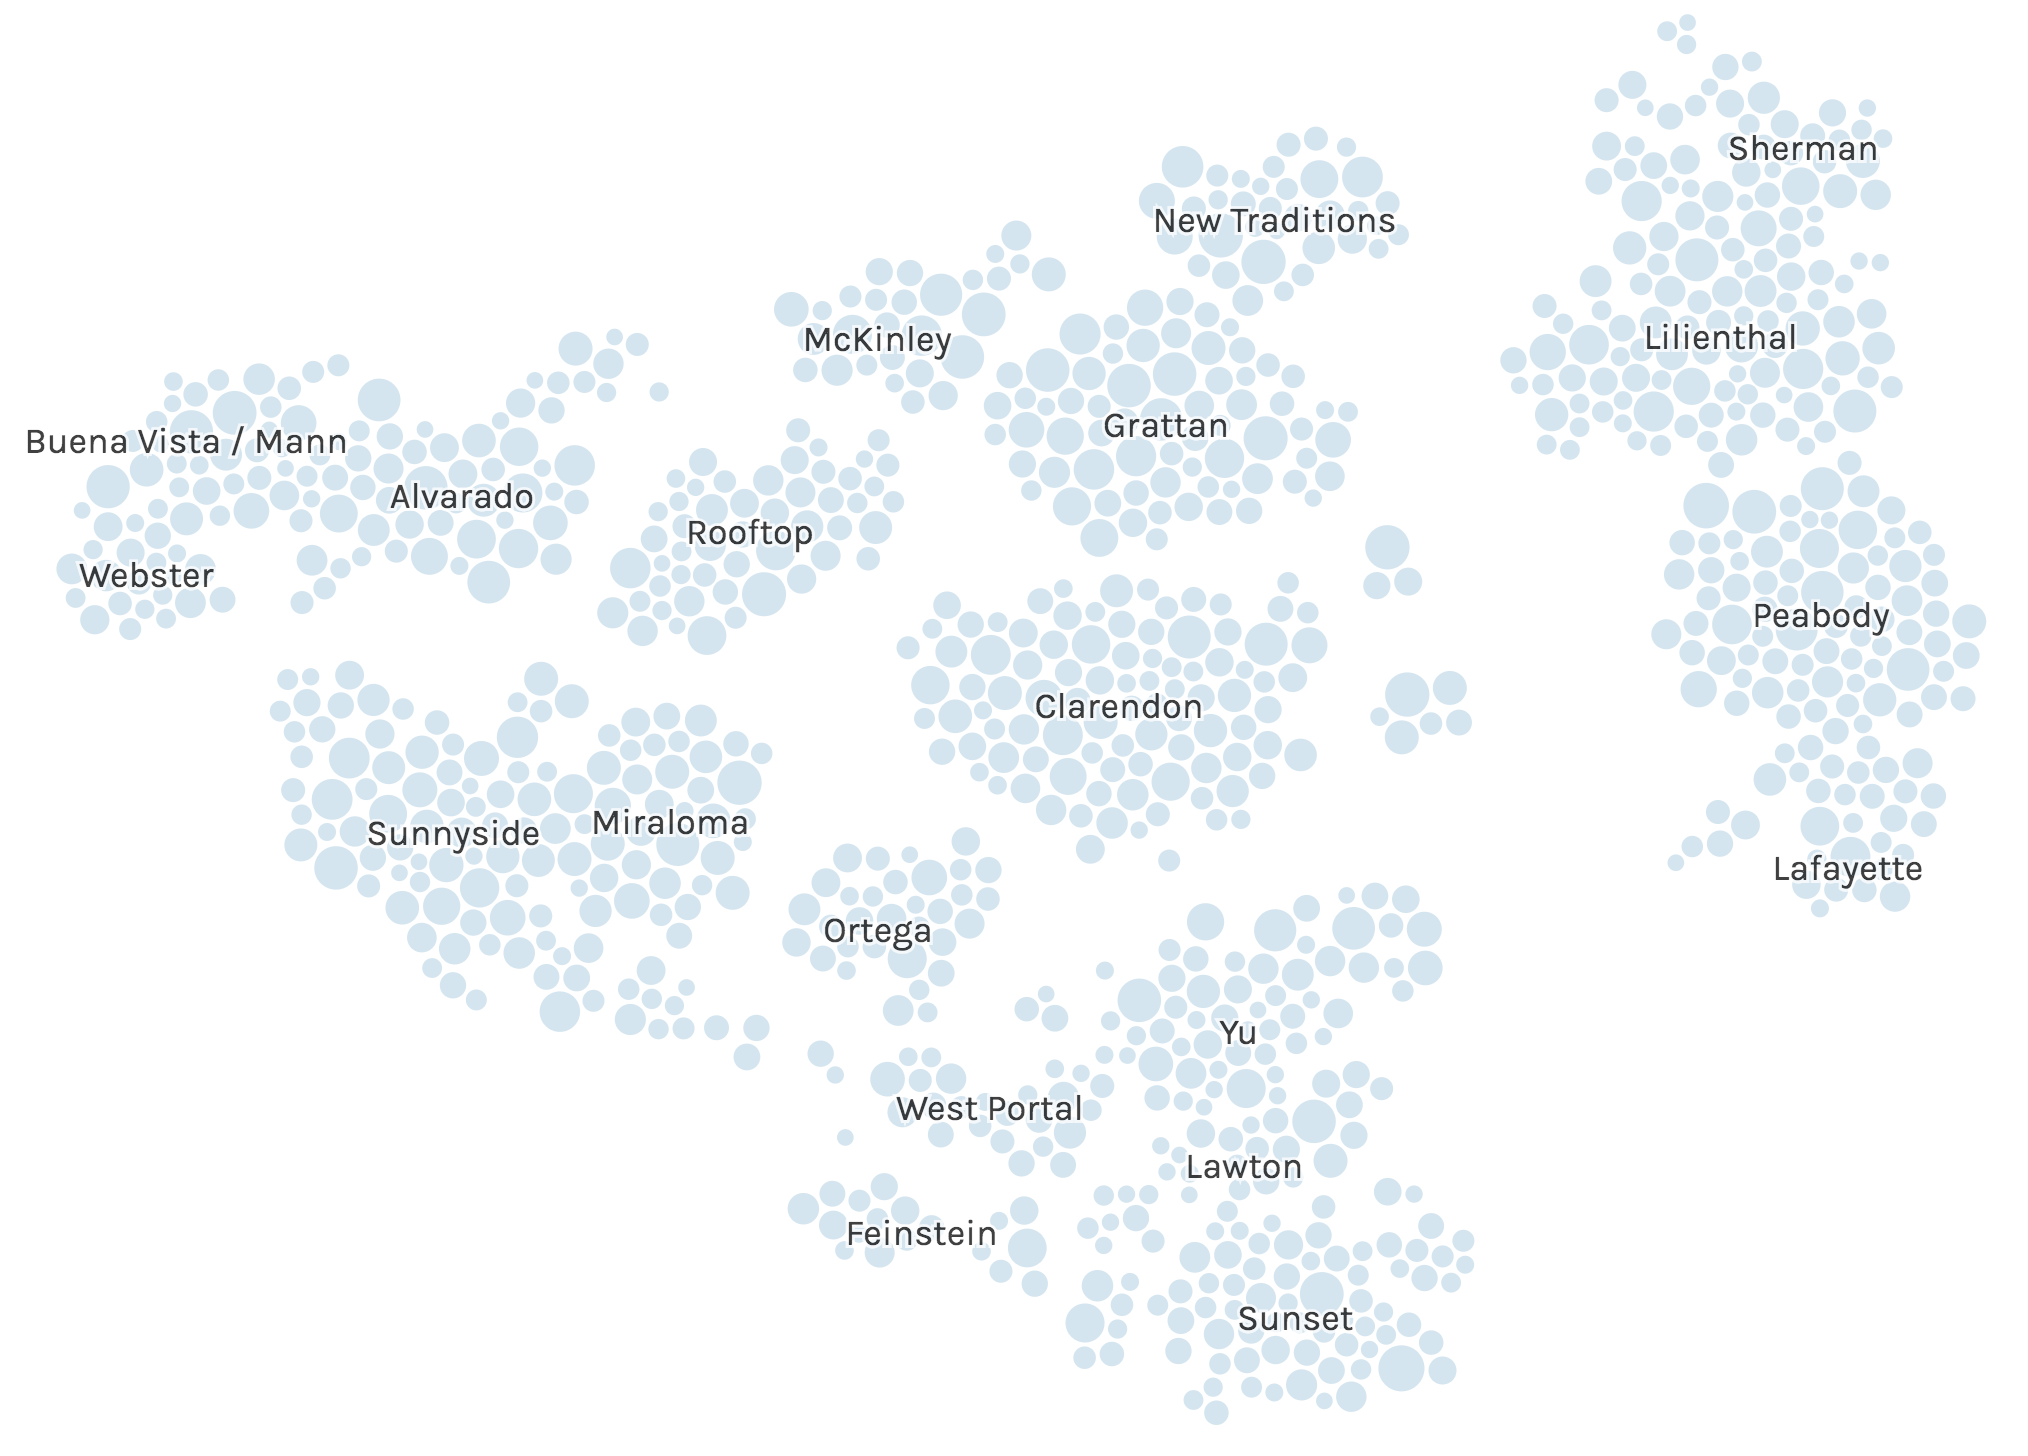
SF Kindergarten Applications
Example of a scrolling story that becomes interactively searchable at the end.
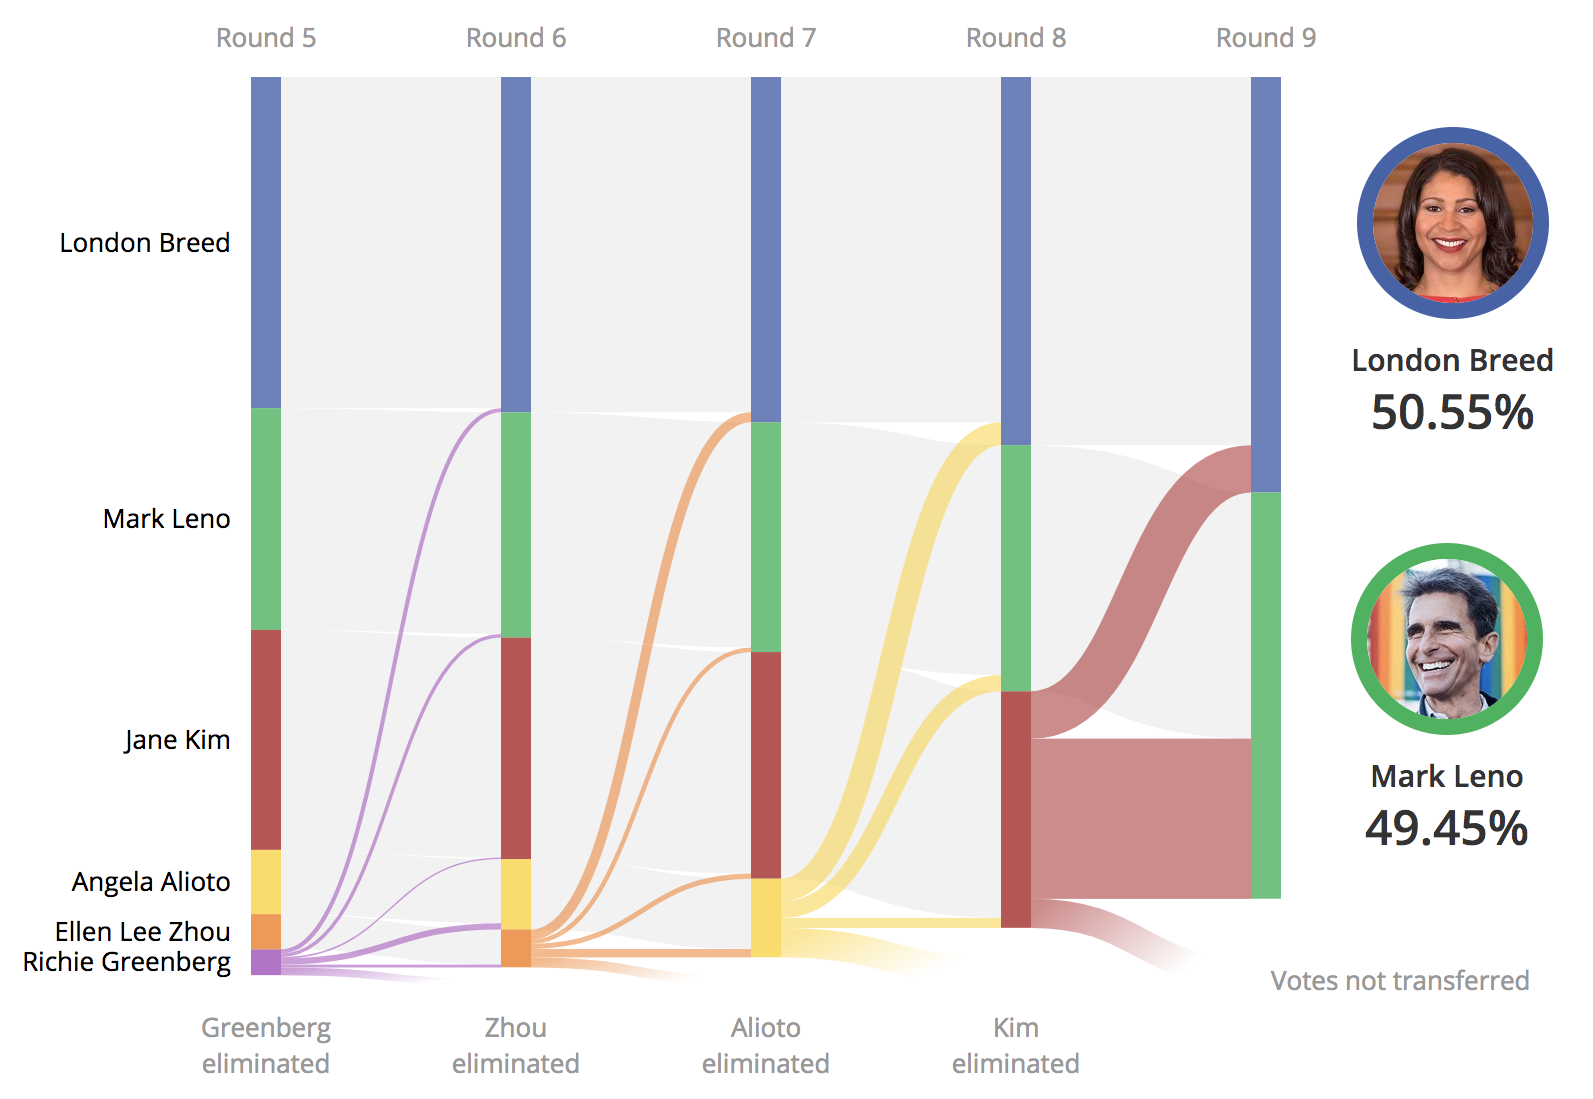
Ranked-Choice Voting
Visualizing the results of the 2018 election for mayor of San Francisco.
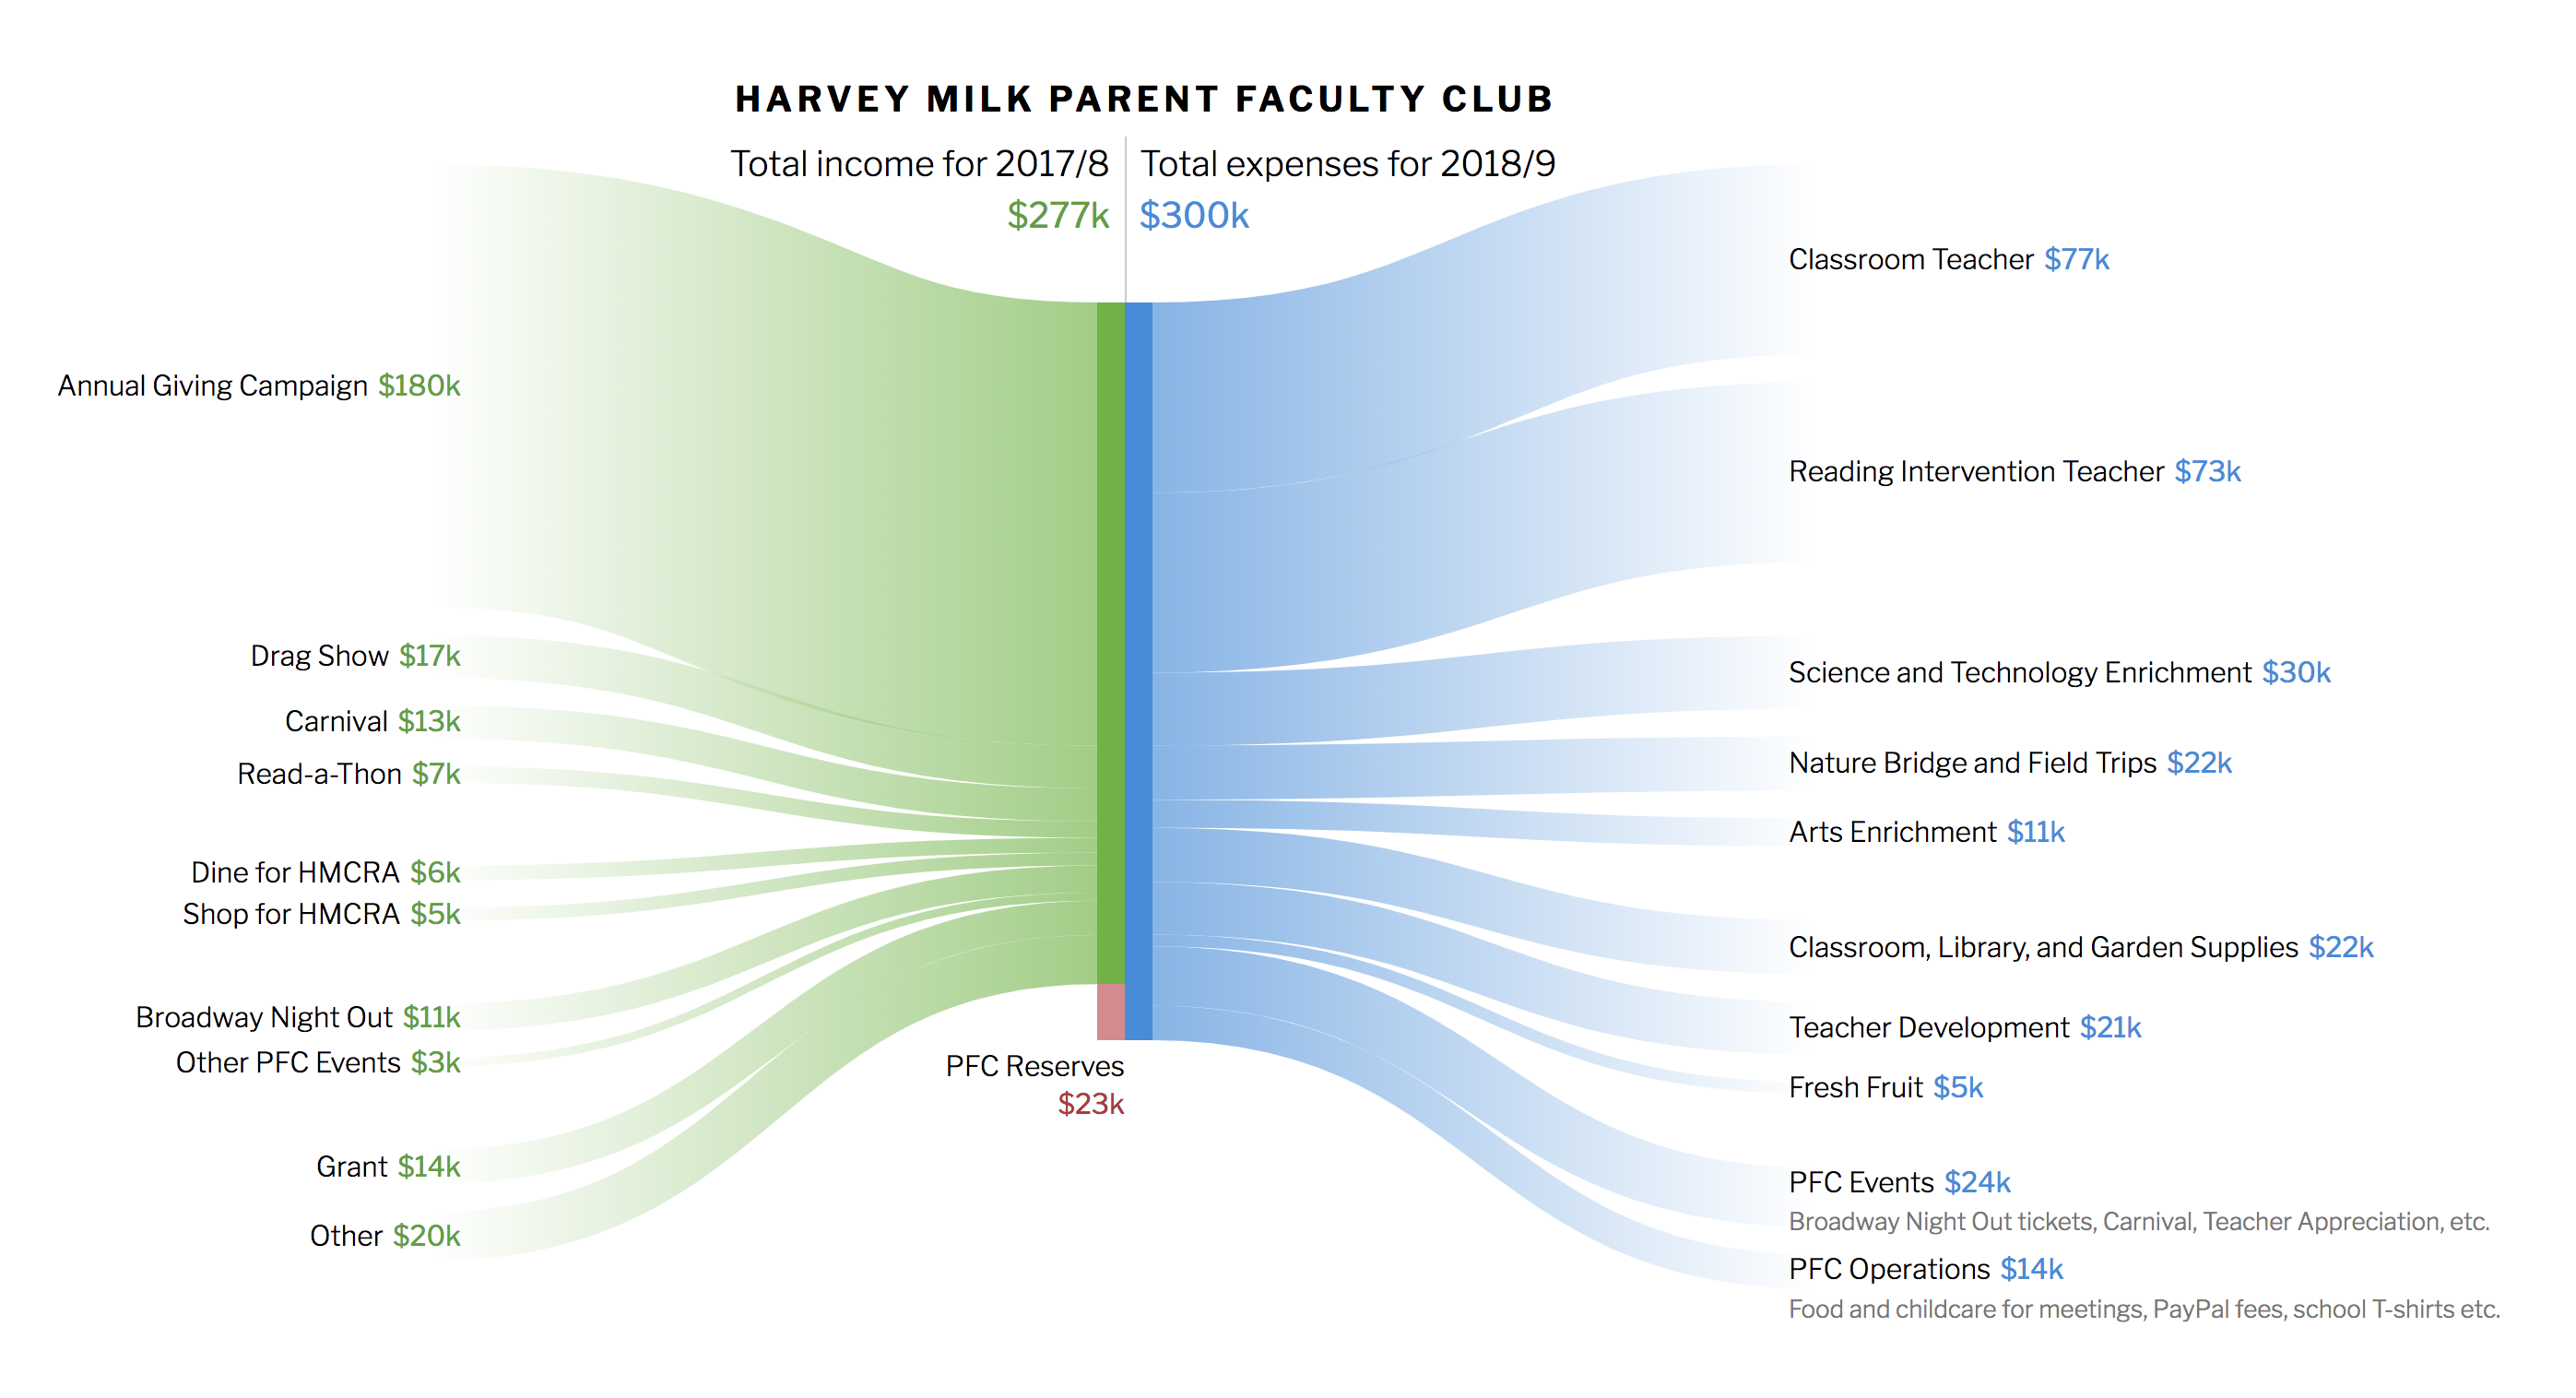
Budget Flow
Visualizing a budget in terms of the flow of inputs and outputs.
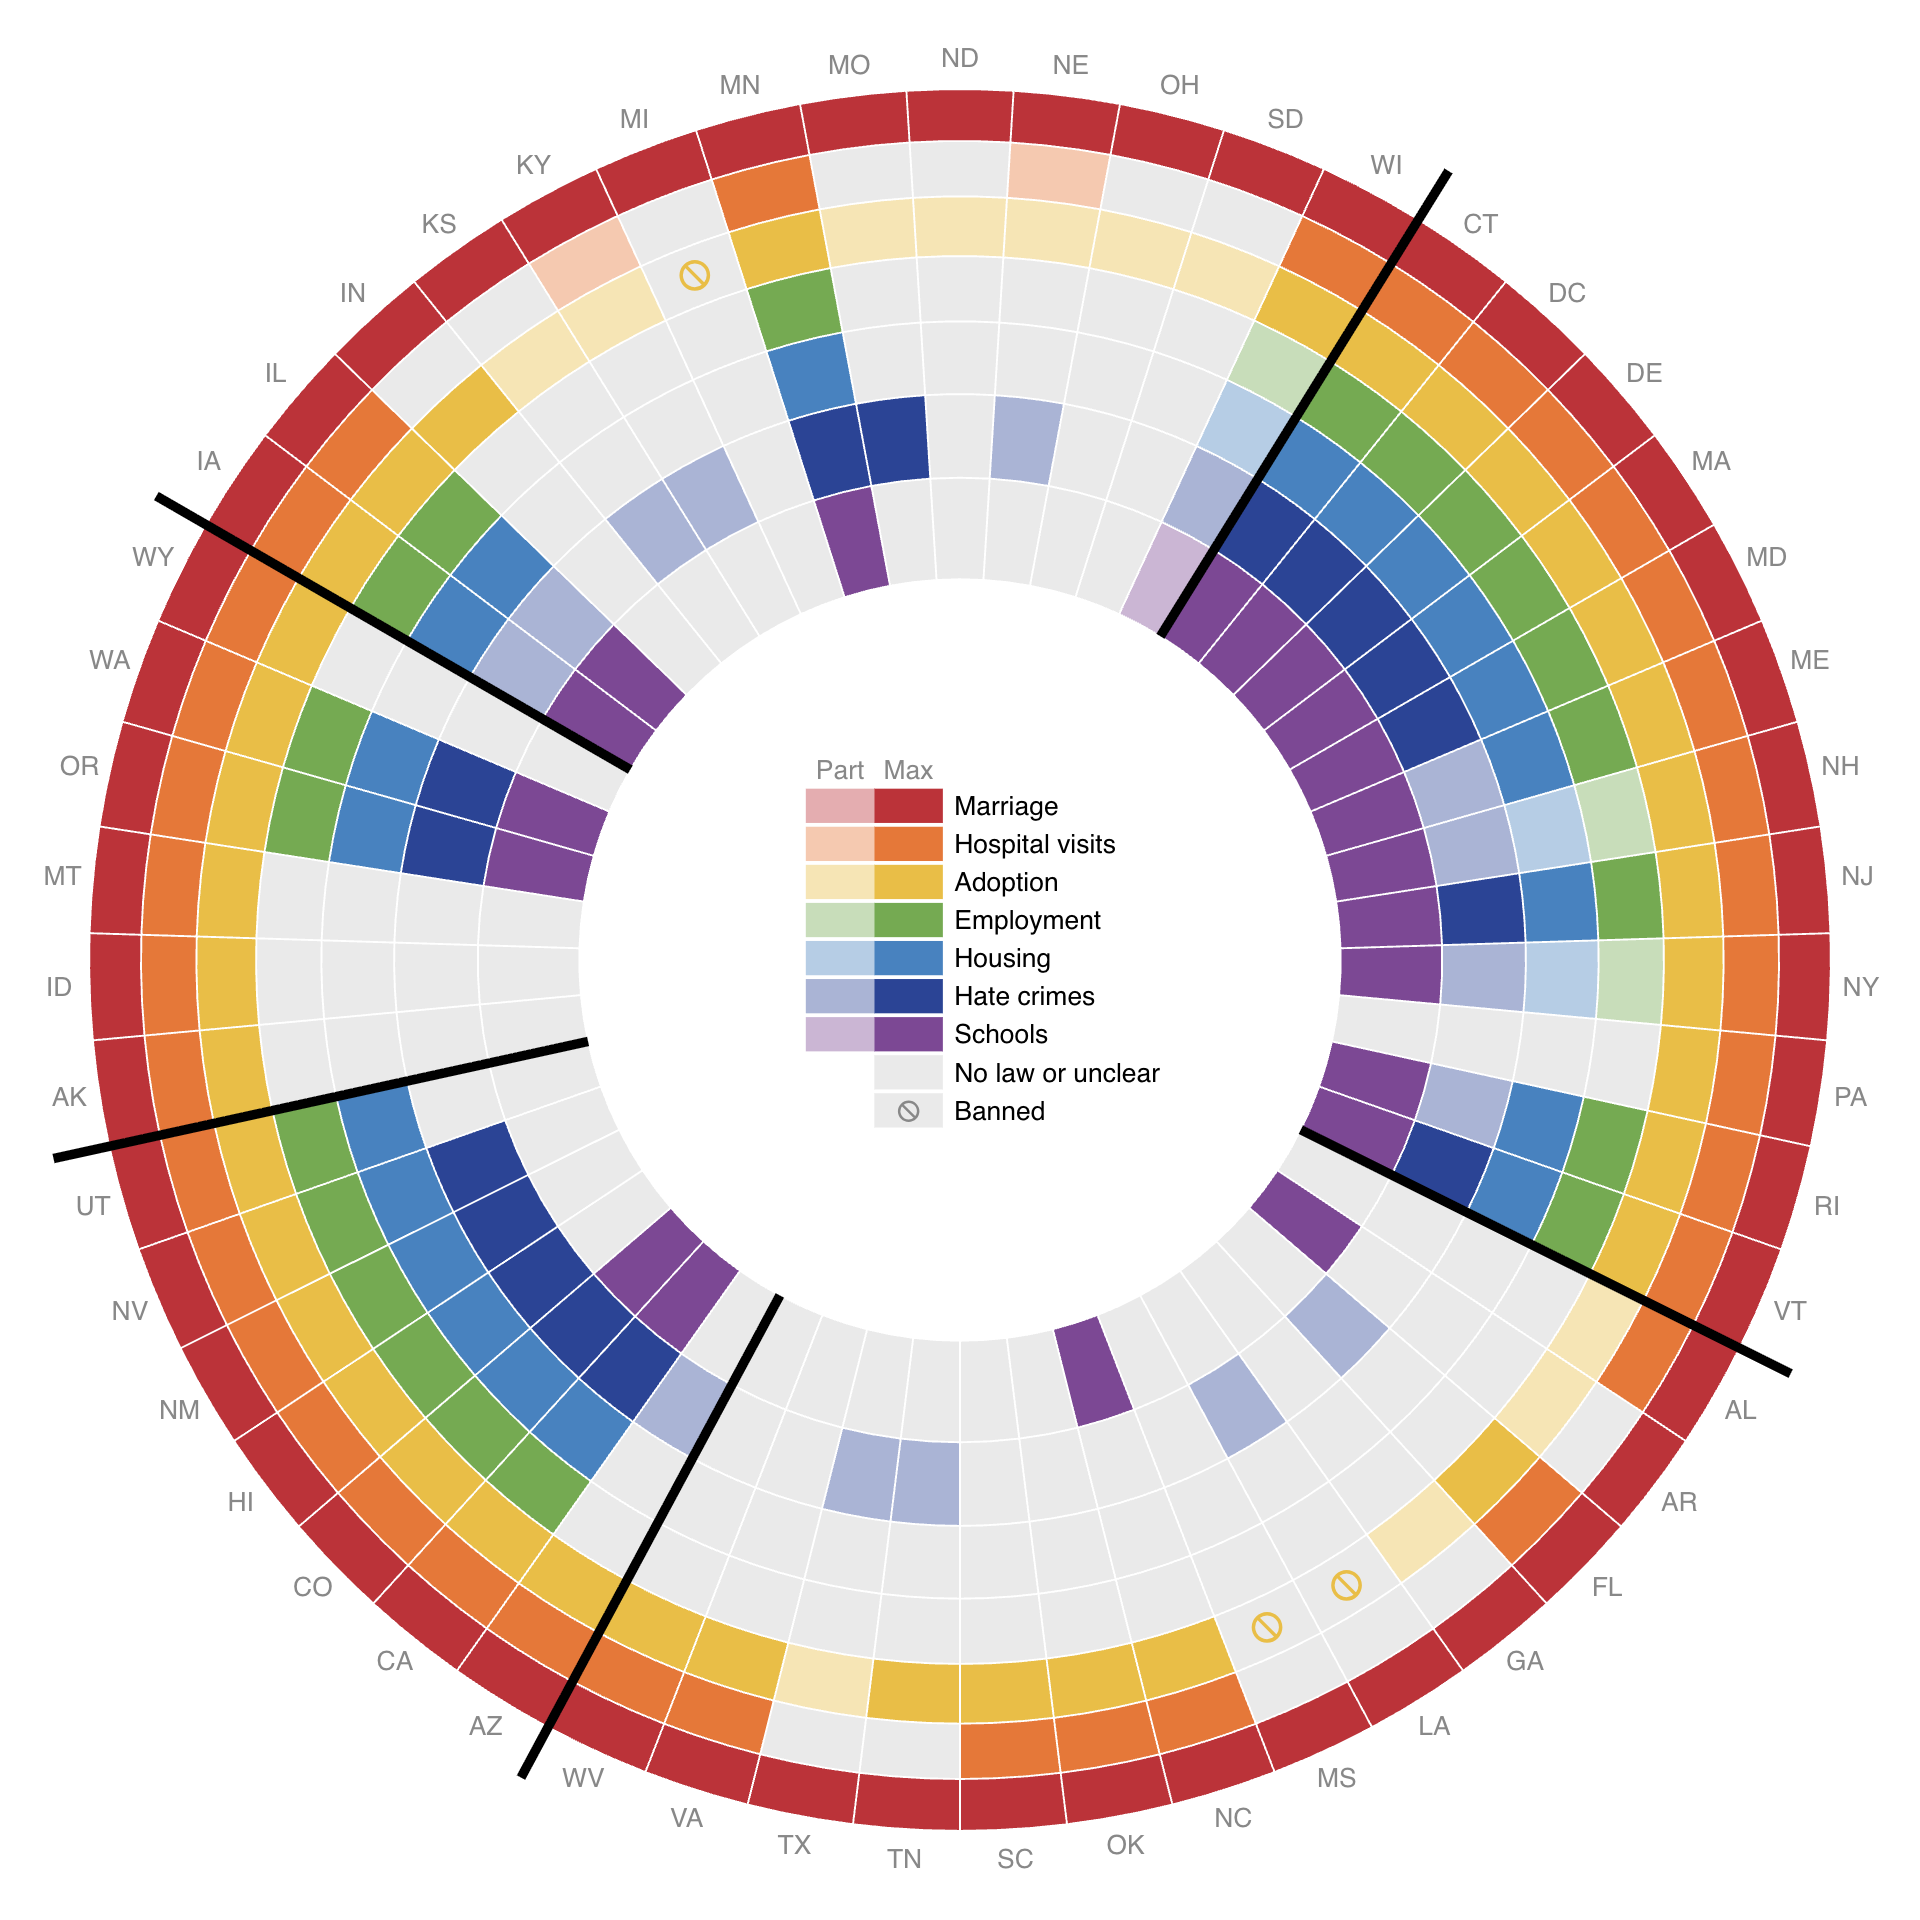
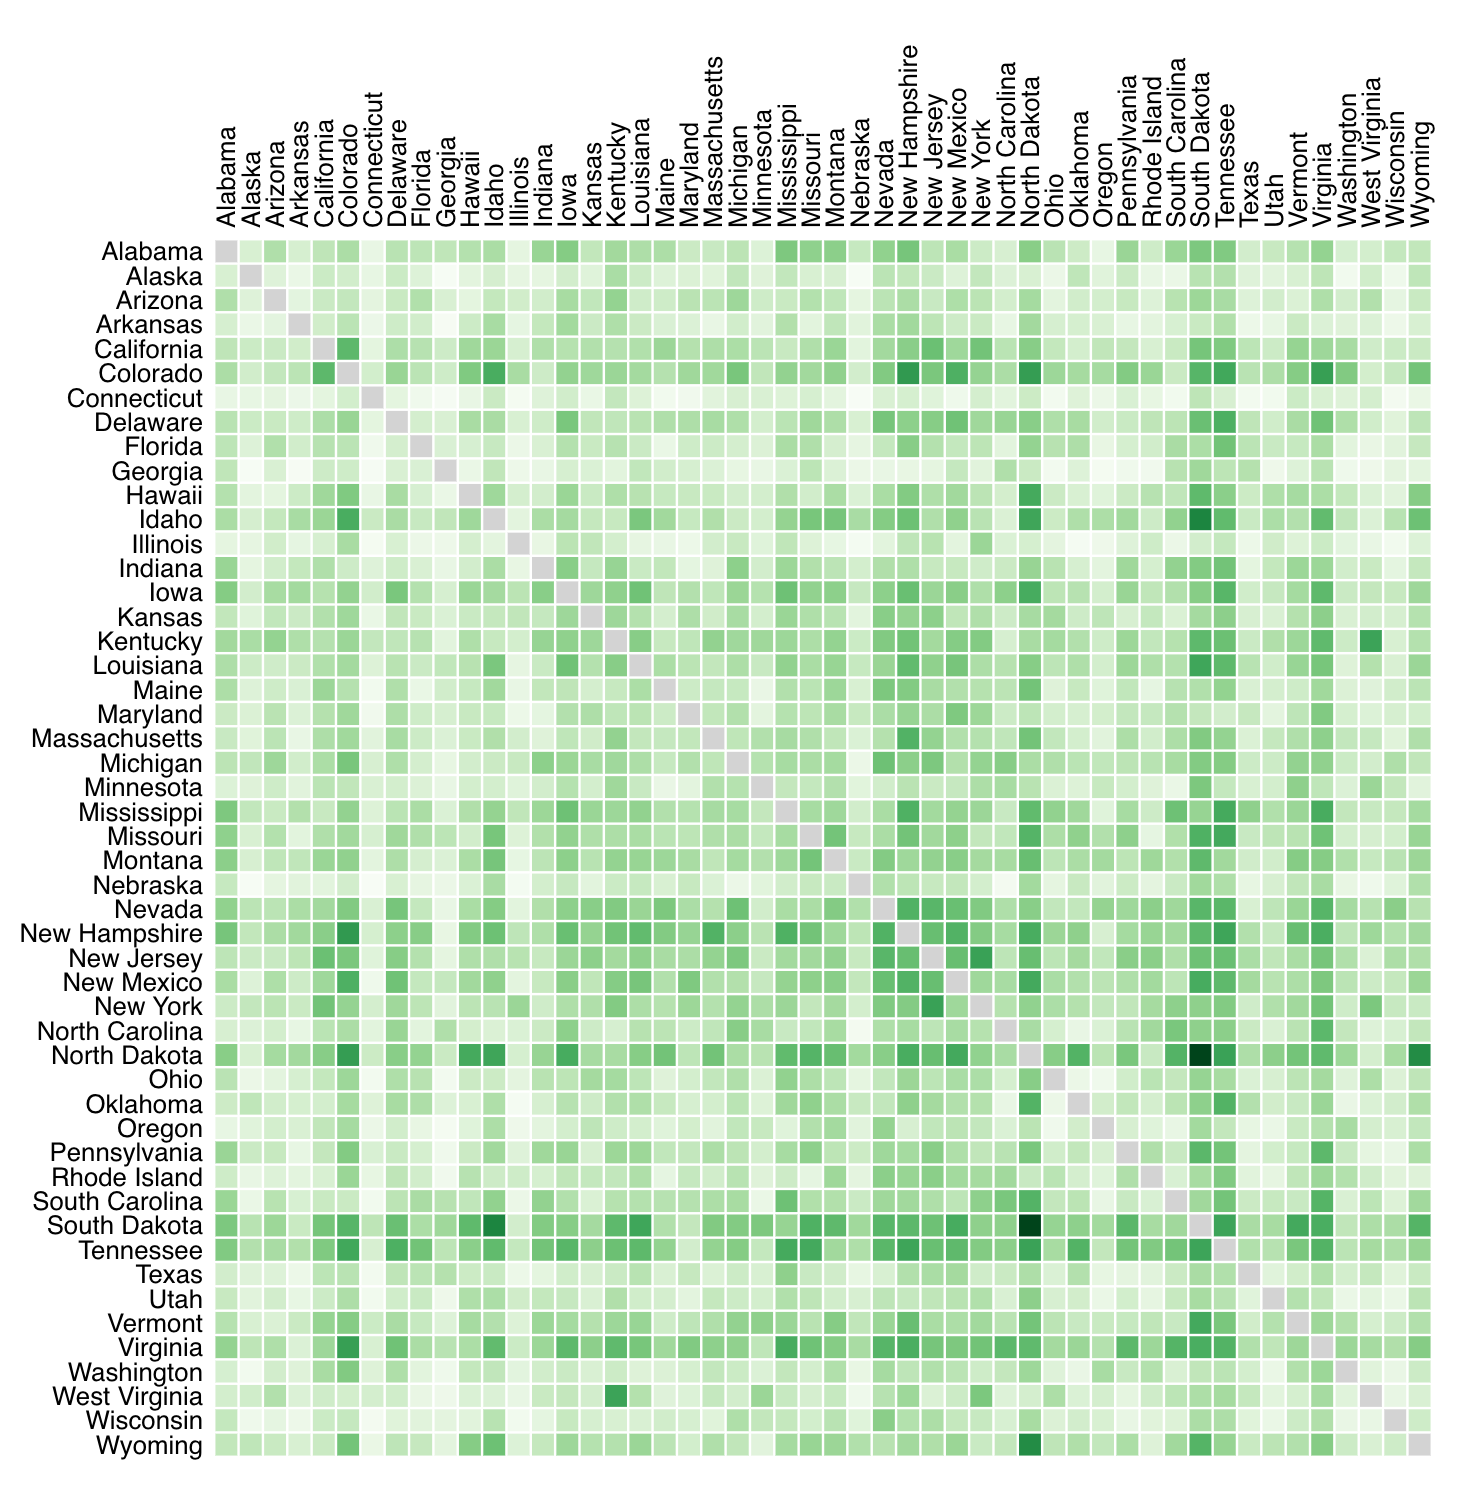
LGBTQ Rights by State
Illustrating the impact of different scaling techniques and color palettes in a radial matrix visualization.
TF-IDF Explainer
Interactive explanation of the TF-IDF text analysis algorithm.

Image Distortion with Perlin Noise
Creative coding experiment, manipulating photographs with a technique normally used for image generation.
Background and Experience
- I design and code interactive data visualizations, turning complex data into useful insights.
- I also teach data visualization, including developing a brand new data visualization course for a Masters program at UC Berkeley.
- Previously, I originated the role of Quantitative UX Researcher at Google, and I am a co-author of the book Quantitative User Experience Research.
- I co-created the HEART framework, an industry-standard approach to UX metrics.
- I did my PhD in human-computer interaction at Cambridge, and continued to publish at Google. See my academic publications page for more.